Tutorial - Analysis-components
Introduction to the Oszilloskop-Function
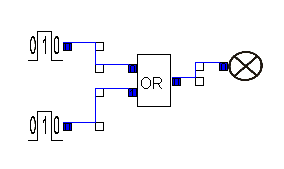
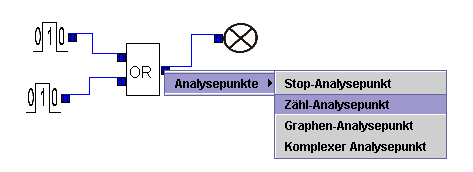
- As an example, the following cirquit is given:
At the waypoints, by rightclicking the following dialog is opened:
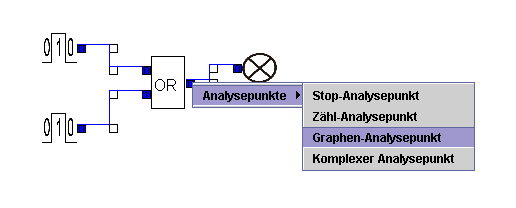
By choosing "Analysepunkte" -> "GraphenAnalysepunkt" the waypoint is set as a measure-point for the oszilloskope.
The simulation is started by the following button:
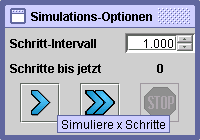
After passing several clock-cycles stop the simulation by pressing the same button.
Then choose "Tools" -> "Analyse"
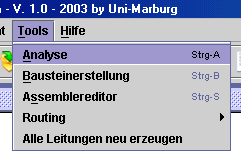
and start the analysis-window.
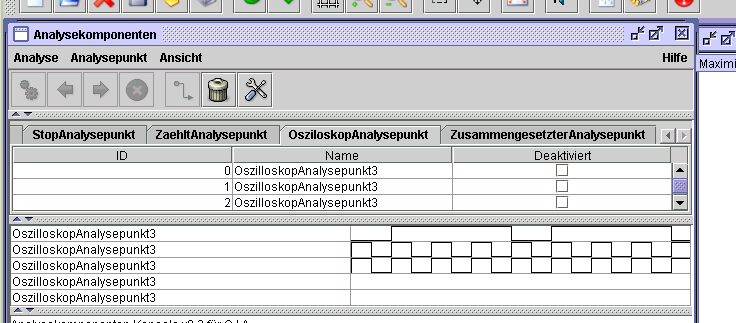
And there the graph for the waypoints can be viewed::
The complex Analysis-Point
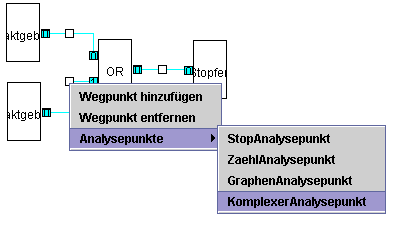
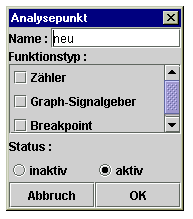
By right-clicking on a waypoint a "complex analysis-point" can be selected.
It offers several analysis-functions, as well as giving the point a name.
It's also possible to edit the"complex analysis-point" by choosing the point and clicking the tool-icon.
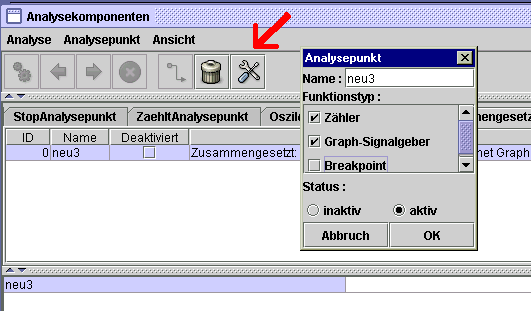
The choosable function-type "Zähler" or "Breakpoint" can also directly be defined at the waypoint.
Important
It's necessary to press the "Simulation starten" - button to start and stop the analysis, because elseway nothing is recorded.