Graphics Programming
2D Objects: Vector and Raster Graphics
Thorsten Thormählen
October 17, 2025
Part 3, Chapter 1
Thorsten Thormählen
October 17, 2025
Part 3, Chapter 1
This is the print version of the slides.
Advance slides with the → key or
by clicking on the right border of the slide
Slides can also be advanced by clicking on the left or right border of the slide.
| Type | Font | Examples |
|---|---|---|
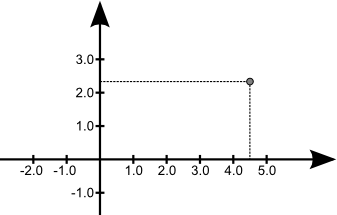
| Variables (scalars) | italics | $a, b, x, y$ |
| Functions | upright | $\mathrm{f}, \mathrm{g}(x), \mathrm{max}(x)$ |
| Vectors | bold, elements row-wise | $\mathbf{a}, \mathbf{b}= \begin{pmatrix}x\\y\end{pmatrix} = (x, y)^\top,$ $\mathbf{B}=(x, y, z)^\top$ |
| Matrices | Typewriter | $\mathtt{A}, \mathtt{B}= \begin{bmatrix}a & b\\c & d\end{bmatrix}$ |
| Sets | calligraphic | $\mathcal{A}, B=\{a, b\}, b \in \mathcal{B}$ |
| Number systems, Coordinate spaces | double-struck | $\mathbb{N}, \mathbb{Z}, \mathbb{R}^2, \mathbb{R}^3$ |
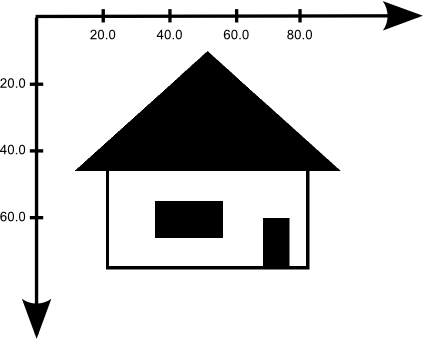
public void paint(Graphics g) {
  Graphics2D g2d = (Graphics2D) g; // cast to Graphics2D
  g2d.draw(new Rectangle2D.Double(20.75, 45.0, 60.0, 30.00) );
  g2d.fill(new Rectangle2D.Double(67.33, 60.0,  8.0, 15.00) );
  g2d.fill(new Rectangle2D.Double(35.00, 55.0, 20.3, 11.00) );
  GeneralPath triangle = new GeneralPath();
  triangle.moveTo(10.75, 46.0);
  triangle.lineTo(90.75, 46.0);
  triangle.lineTo(50.75, 10.0);
  triangle.closePath();
  g2d.fill(triangle);
 }
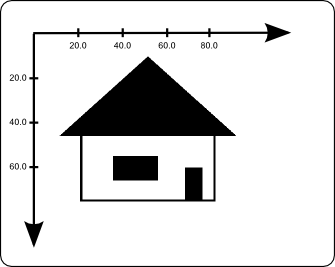
Full source code:
House2D.java
To create 2D vector graphics, there are many free and commercial programs:
Popular file formats for storing 2D vector graphics are:
class RasterImage {
  protected int imageWidth;
  protected int imageHeight;
  protected int[] imageData;

  public RasterImage(int width, int height) {
    imageData = new int[width*height]; ...
  }
  public int getPixel(int x, int y) {
    return imageData[y*imageWidth+x];
  }
  public void setPixel(int pixelValue, int x, int y) {
    imageData[y*imageWidth+x] = pixelValue;
  }
  ...
};
template<typename T> class RasterImage {
  protected:
    unsigned imageWidth;
    unsigned imageHeight;
    T* imageData;
  public:
    RasterImage(unsigned width, unsigned height) {
      imageData = new T[width*height]; ...
    }
    const T getPixel(unsigned x, unsigned y) const {
      return imageData[y*imageWidth+x];
    }
    void setPixel(T pixelValue, unsigned x, unsigned y) {
      imageData[y*imageWidth+x] = pixelValue;
    }
    ...
};
MyPaintPanel extends JPanel {
  private BufferedImage img = null;
  public void createGUI() {
    try { img = ImageIO.read(new File("./horse.jpg")); }
    catch (IOException e) { System.out.println("failed to load image"); }
    ...
  }
  public void paint(Graphics g) {
    super.paint(g); Graphics2D g2d = (Graphics2D) g;
    int oldRgb = img.getRGB(10, 100); // read a pixel
    int rgb = 0xFFFF0000; // Alpha-Red-Green-Blue
    img.setRGB(10, 100, rgb); // draw red pixel
    g.drawImage(img, 0, 0, null);
  }
}
Source code of the example: MyBufferedImage.java
There are many free and commercial image editing programs:
Popular file formats for raster graphics are:
Please notify me by e-mail if you have questions, suggestions for improvement, or found typos: Contact