Control Keys

move to next slide (also Enter or Spacebar).
move to previous slide.
 d  enable/disable drawing on slides
 p  toggles between print and presentation view
CTRL  +  zoom in
CTRL  -  zoom out
CTRL  0  reset zoom

Slides can also be advanced by clicking on the left or right border of the slide.

Notation

Type Font Examples
Variables (scalars) italics $a, b, x, y$
Functions upright $\mathrm{f}, \mathrm{g}(x), \mathrm{max}(x)$
Vectors bold, elements row-wise $\mathbf{a}, \mathbf{b}= \begin{pmatrix}x\\y\end{pmatrix} = (x, y)^\top,$ $\mathbf{B}=(x, y, z)^\top$
Matrices Typewriter $\mathtt{A}, \mathtt{B}= \begin{bmatrix}a & b\\c & d\end{bmatrix}$
Sets calligraphic $\mathcal{A}, B=\{a, b\}, b \in \mathcal{B}$
Number systems, Coordinate spaces double-struck $\mathbb{N}, \mathbb{Z}, \mathbb{R}^2, \mathbb{R}^3$

Basic math

Scalar Product

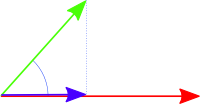
scalarproduct
$\mathbf{a}$
$\mathbf{b}$
$\alpha$
$\mathbf{a}_{\mathbf{b}}$
  • The scalar product (aka dot product) combines two vectors $\mathbf{a}$ and $\mathbf{b} \in \mathbb{R}^N$. Result is a scalar.
  • Scalar product: $\langle \mathbf{a} \cdot \mathbf{b}\rangle = \mathbf{a}^\top \mathbf{b} = \sum\limits_{i=1}^N a_i b_i$
  • Scalar product in $\mathbb{R}^3$: $\mathbf{a}^\top \mathbf{b} = (a_1, a_2, a_3) \begin{pmatrix}b_1\\b_2 \\ b_3 \end{pmatrix} = a_1 b_1 + a_2 b_2 + a_3 b_3$
  • Commutative: $\langle \mathbf{a} \cdot \mathbf{b}\rangle = \langle \mathbf{b} \cdot \mathbf{a}\rangle$
  • Cosine law: $\langle \mathbf{a} \cdot\mathbf{b}\rangle = |\mathbf{a}| |\mathbf{b}| \cos \alpha$
  • Orthogonal vectors: $\mathbf{a} \perp \mathbf{b} \rightarrow \langle \mathbf{a} \cdot \mathbf{b}\rangle = 0$
  • Vertical projection: $\mathbf{a}_{\mathbf{b}} = (\mathbf{a}^\top \frac{\mathbf{b}}{|\mathbf{b}| }) \frac{\mathbf{b}}{|\mathbf{b}| }$
  • Relation to matrix multiplication:
    $\begin{bmatrix}a_{11} & a_{12}\\a_{21} & a_{22}\end{bmatrix}\begin{bmatrix}b_{11} & b_{12}\\b_{21} & b_{22}\end{bmatrix} = \begin{bmatrix}\mathbf{a}_1^\top\\ \mathbf{a}_2^\top\end{bmatrix}\begin{bmatrix}\mathbf{b}_1 & \mathbf{b}_2\end{bmatrix} = \begin{bmatrix}\mathbf{a}_1^\top\mathbf{b}_1 & \mathbf{a}_1^\top\mathbf{b}_2\\ \mathbf{a}_2^\top\mathbf{b}_1 & \mathbf{a}_2^\top\mathbf{b}_2 \end{bmatrix}$

Cross Product

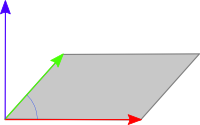
scalarproduct
$\mathbf{a}$
$\mathbf{b}$
$\alpha$
$\mathbf{a} \times \mathbf{b}$
$|\mathbf{a} \times \mathbf{b}|$
  • The cross product combines two vectors $\mathbf{a}$ and $\mathbf{b} \in \mathbb{R}^3$. The result is a new vector $\mathbf{c} = \mathbf{a} \times \mathbf{b} \in \mathbb{R}^3$.
  • Cross product: $\begin{pmatrix}a_1\\a_2 \\ a_3 \end{pmatrix} \times \begin{pmatrix}b_1\\b_2 \\ b_3 \end{pmatrix} = \begin{pmatrix}a_2 b_3 - a_3 b_2\\ a_3 b_1 - a_1 b_3 \\ a_1 b_2 - a_2 b_1 \end{pmatrix}$
  • Matrix notation: $\mathbf{a} \times \mathbf{b} = \begin{bmatrix}0 & -a_3 & a_2 \\a_3 & 0 & -a_1 \\ -a_2 & a_1 & 0 \end{bmatrix} \mathbf{b} = [\mathbf{a}]_\times \,\mathbf{b}$
  • Antisymmetry: $\mathbf{a} \times \mathbf{b} = -\mathbf{b} \times \mathbf{a}$
  • Sine law: $|\mathbf{a} \times \mathbf{b}| = |\mathbf{a}| |\mathbf{b}| \sin \alpha$
  • Orthogonal vectors: $\mathbf{a} \perp (\mathbf{a} \times \mathbf{b}) \perp \mathbf{b}$

3D Transformations

Raster Conversion of Vector Graphics

  • Vector graphics have the advantage that neither the display resolution nor the region-of-interest are fixed and can be changed at any time
  • Ultimately, however, for displaying vector graphics, they must be converted into raster graphics
  • Since the resolution must be set only when the conversion is required, the resolution can be adapted to the output device
  • Therefore, with a vector graphics representation, a printer or screen can always reach its maximum resolution

Raster Conversion of Lines

  • In this demonstration, a line (line segment) in vector format is converted to a very coarse raster image
  • The end points of the line can be moved interactively with the mouse

Equation of a Line from 2 Points

given: $\mathbf{p}_0 = (x_0, y_0)^\top, \mathbf{p}_1 = (x_1, y_1)^\top$

wanted: equation of the line $\mathrm{g}(\mathbf{p})$ with $\mathbf{p}= (x, y)^\top$
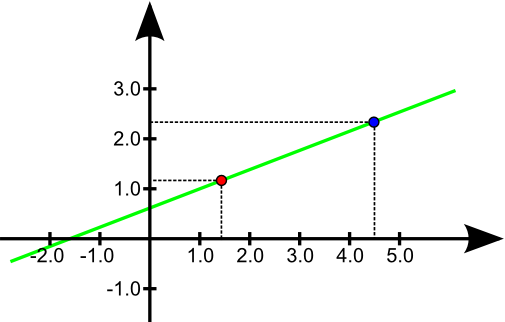
lineani1
$x$-coordinate
$y$-coordinate
$\mathbf{p}_0$
$\mathbf{p}_1$
lineani2
$\mathbf{p}$

from the figure: $\frac{y-y_0}{x-x_0} = \frac{y_1-y_0}{x_1-x_0}$

Equation of a Line from 2 Points

\begin{aligned} \frac{y-y_0}{x-x_0} &= \frac{y_1-y_0}{x_1-x_0} \\ y-y_0 &= \underbrace{\frac{y_1-y_0}{x_1-x_0}}_{m} \, \, (x-x_0) \\ y&= m \, (x - x_0) + y_0\\ y &= m \, x \, \underbrace{- \, m \, x_0 + y_0}_{b}\\ y &= m \, x + b\\ \end{aligned}

Raster Conversion of Lines: A First Attempt

void drawLine(int x0, int y0, int x1, int y1) {
  int dx = x1 - x0;
  int dy = y1 - y0;
  float m = dy / dx;
  for(int x = x0; x <= x1; x++) {
    float y = m * (x - x0) + y0;
    setPixel(x, round(y));  
  }
}
 
 void drawLineFloat(float x0, float y0, float x1, float y1) {
   drawLine(round(x0), round(y0), round(x1), round(y1)) ;
 }
 

Is it working?

  • In this demonstration, the endpoints of the line can be moved interactively with the mouse

Problems with the first attempt

Problem 1: Works only for $x_1 > x_0$

Solution: Swap points if $x_1 < x_0$, and draw single pixel if $x_1 = x_0$.
 

Problem 2: Gaps in the line when absolute value of $\Delta_y = y_1-y_0$ is larger than the absolute value of $\Delta_x = x_1-x_0$

Solution: The gaps appear, since the loop runs over $x$. Therefore, loop over $y$ if $|\Delta_y|>|\Delta_x|$

Raster Conversion of Lines: Distinction of Cases

drawLine(int x0, int y0, int x1, int y1) {
  int dy = y1 - y0;
  int dx = x1 - x0;
  if(dx == 0 && dy ==0) { setPixel(x0, y0); return;}  
  
  if(abs(dx) >= abs(dy)) {
    if (x1 > x0) drawLineX(x0, y0, x1, y1); 
    else drawLineX(x1, y1, x0, y0);
  }else{
    if (y1 > y0) drawLineY(x0, y0, x1, y1); 
    else drawLineY(x1, y1, x0, y0);
  } 
}

void drawLineX(int x0, int y0, int x1, int y1) {
  int dy = y1 - y0;
  int dx = x1 - x0;
  float m = dy / dx;
  for(int x = x0; x <= x1; x++) {
    float y = m * (x - x0) + y0;
    setPixel(x, round(y));  
  }
}

void drawLineY(int x0, int y0, int x1, int y1) {
  int dy = y1 - y0;
  int dx = x1 - x0;
  float mInv = dx / dy;
  for(int y = y0; y <= y1; y++) {
    float x =  mInv * (y - y0) + x0;
    setPixel(round(x), y);  
  }
}
 

Raster Conversion of Lines: Acceleration

  • Each loop pass requires a multiplication, several additions, and a rounding
  • Idea: An incremental algorithm saves operations
  • Based on the equation of the line $y = m \, x + b$ and with $(x_{i+1}-x_i)=1$ (where $i$ denotes the iteration index), we have:

\begin{aligned} y_{i+1} &= m \, x_{i+1} + b\\ y_{i+1} &= m \, \left(x_i + (x_{i+1}-x_i)\right) +b \\ y_{i+1} &= y_i + m \,(x_{i+1}-x_i)\\ y_{i+1} &= y_i + m\\ \end{aligned}

Raster Conversion of Lines: Acceleration

void drawLineXFaster(int x0, int y0, int x1, int y1) {
  int dy = y1 - y0;
  int dx = x1 - x0;
  float m = dy / dx;
  float y = y0;
  for(int x = x0; x <= x1; x++) {
    setPixel(x, round(y));  
    y += m;
  }
}

void drawLineYFaster(int x0, int y0, int x1, int y1) {
  int dy = y1 - y0;
  int dx = x1 - x0;
  float mInv = dx / dy;
  float x = x0;
  for(int y = y0; y <= y1; y++) {
    setPixel(round(x), y);  
    x += mInv;
  }
}


Raster Conversion of Lines: Midpoint Algorithm

Observation of Bresenham (1965):
If the loop runs in $x$ direction and a pixel was drawn, there are only two options for the next pixel:

  • No increase → next pixel $(x+1, y)$
  • Increase by 1 → next pixel $(x+1,y+1)$

The decision, which is the case, can be made by evaluating the position of the midpoint $(x+1, y+0.5)$
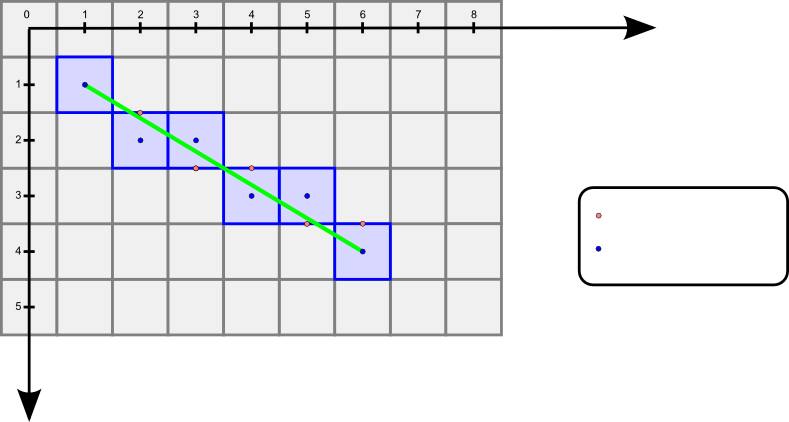
  • Line below midpoint → No increase
  • Line above midpoint → increase by 1
Source: J. E. Bresenham, Algorithm for computer control of a digital plotter, IBM Systems Journal 4, 1 (1965)

Midpoint Algorithm

midpoint
Midpoint
Pixel center

Midpoint Algorithm

\begin{aligned} \frac{y-y_0}{x-x_0} &= \frac{y_1-y_0}{x_1-x_0} \\ (y-y_0)\, \underbrace{(x_1-x_0)}_{\Delta_x}&= \underbrace{(y_1-y_0)}_{\Delta_y}\, \, (x-x_0) \\ (y-y_0)\, \Delta_x&= \Delta_y\, \, (x-x_0) \\ 0 &= \Delta_y \,x - \Delta_x \, y - \Delta_y \, x_0 + \Delta_x \, y_0 \\ \mathrm{g}(x,y) &= \underbrace{\Delta_y}_{a} \,x \, \underbrace{- \Delta_x}_{b} \, y + \underbrace{\Delta_x \, y_0 - \Delta_y \, x_0 }_{c} \\ \mathrm{g}(x,y) &= a x + b y + c \end{aligned}

Midpoint Algorithm

Implicit line equation:

\begin{aligned} \mathrm{g}(x,y) &= a x + b y + c \\ \end{aligned}

  • If $\mathrm{g}(x,y)=0$ → point on the line
  • If $\mathrm{g}(x,y) < 0$ → point below the line
  • If $\mathrm{g}(x,y) > 0$ → point above the line

Midpoint algorithm:

  • If $\mathrm{g}(x+1, y+0.5) \le 0$ → No increase
  • If $\mathrm{g}(x+1, y+0.5) > 0$ → increase by 1

Midpoint Algorithm

Incremental computation of the decision variable $d_{i} = \mathrm{g}(x+1, y+0.5) $:

\begin{aligned} \mathrm{g}(x,y) &= \Delta_y \,x - \Delta_x \, y \, + \underbrace{\Delta_x \, y_0 - \Delta_y \, x_0 }_{c} \\ \mathrm{g}(x+1, y+0.5) &= \Delta_y \,(x+1) - \Delta_x \, (y+0.5) + c \end{aligned}

If no increase:

\begin{aligned} \mathrm{g}(x+2, y+0.5) &= \Delta_y \,(x+2) - \Delta_x \, (y+0.5) + c \\ &= \mathrm{g}(x+1, y+0.5) + \Delta_y \\ d_{i+1} &= d_i + \Delta_y \end{aligned}

If incremented by 1:

\begin{aligned} \mathrm{g}(x+2, y+1.5) &= \Delta_y \,(x+2) - \Delta_x \, (y+1.5) + c \\ &= \mathrm{g}(x+1, y+0.5) + \Delta_y - \Delta_x\\ d_{i+1} &= d_i + \Delta_y - \Delta_x \end{aligned}

Midpoint Algorithm

In addition, the initial value $d_0$ of the decision variable is needed:

\begin{aligned} d_0 &= \mathrm{g}(x_0+1, y_0+0.5)\\ &= \Delta_y \,(x_0+1) - \Delta_x \, (y_0+0.5) + c\\ &= \Delta_y \,x_0 + \Delta_y - \Delta_x \, y - 0.5 \Delta_x + c\\ &= \Delta_y \,x_0 - \Delta_x \, y + \Delta_y - 0.5 \Delta_x + c\\ &= \underbrace{\mathrm{g}(x_0, y_0)}_{=0} + \Delta_y - 0.5 \Delta_x \\ &= \Delta_y - 0.5 \Delta_x \\ \end{aligned}

Midpoint Algorithm

  • Trick: When calculating the decision variable only the signs matter
  • Therefore, it is possible to use $\hat{d}= 2 d$ instead of $d$ as a decision variable
  • The advantage is that only integer arithmetic must be used for calculation
    • Initialization:          $\hat{d}_0 = 2 \Delta_y - \Delta_x$
    • If no increase:       $\hat{d}_{i+1} = \hat{d}_i + 2 \Delta_y$
    • If incremented by 1: $\hat{d}_{i+1} = \hat{d}_i + 2 \Delta_y - 2 \Delta_x$

Midpoint Algorithm

void drawLineXEvenFaster(int x0, int y0, int x1, int y1) {
  int dx = x1 - x0; 
  int dy = abs(y1 - y0);
  int twoDx = dx + dx; 
  int twoDy = dy + dy;
  int dHat = twoDy - dx; // init decision variable 
  int incr = 1; if (y1 < y0) incr = -1; // increase or decrease y
    
  for(int x = x0, y = y0; x <= x1; x++) {
    setPixel(x, y);  
    if(dHat <= 0) { // no increment
      dHat += twoDy; 
    } else {        // increment
      dHat += twoDy - twoDx; 
      y += incr; 
    }
  }
}

void drawLineYEvenFaster(int x0, int y0, int x1, int y1) {
  int dx = abs(x1 - x0); 
  int dy = y1 - y0;
  int twoDx = dx + dx; 
  int twoDy = dy + dy;
  int dHat = twoDx - dy; // init decision variable 
  int incr = 1; if (x1 < x0) incr = -1; // increase or decrease y
  
  for(int y = y0, x = x0; y <= y1; y++) {
    setPixel(x, y);  
    if(dHat <= 0) { // no increment
      dHat += twoDx; 
    } else {        // increment 
      dHat += twoDx - twoDy; 
      x += incr; 
    }
  }
}

Midpoint Algorithm for Lines

  • In this demonstration, the endpoints of the line can be moved interactively with the mouse

Raster Conversion of Circles

Raster Conversion of Circles

Implicit function of a circle with radius $r$:

\begin{aligned} \mathrm{g}(x,y) &= x^2 + y^2 - r^2 \\ \end{aligned}

  • If $\mathrm{g}(x,y)=0$ → point on the circle
  • If $\mathrm{g}(x,y) < 0$ → point inside the circle
  • If $\mathrm{g}(x,y) > 0$ → point outside the circle

Raster Conversion of Circles

  • The approach for drawing circles is very similar to that for lines
  • Due to the symmetry, however, only one-eighth of the circumference has to be calculated and the other pixels can be copied
  • Therefore, for drawing a circle a distinction of cases is not required
  • When calculating the circle's pixels, it is assumed that the circle is at the origin. The result can then be easily moved to account for a different position of the center.

Midpoint Algorithm for Circles

  • The midpoint algorithm for circles is very similar to the one for lines. It uses the implicit equation of a circle and evaluates the position of the next pixel midpoint $(x+1, y-0.5)$
  • When the loop is run in positive $x$-direction, $y$ can be initialized with the radius.
  • Therefore, we have $x_\mathrm{init} = 0$ and $y_\mathrm{init} = r$

Midpoint algorithm:

  • If $\mathrm{g}(x+1, y-0.5) \le 0$ → No reduction of $y$
  • If $\mathrm{g}(x+1, y-0.5) > 0$ → Reduction of $y$ by 1

Midpoint Algorithm for Circles

Incremental computation of the decision variable $d_{i} = \mathrm{g}(x+1, y-0.5)$:

\begin{aligned} \mathrm{g}(x,y) &= x^2 + y^2 - r^2 \\ \mathrm{g}(x+1, y-0.5) &= (x+1)^2 + (y-0.5)^2 - r^2 = d_{i} \end{aligned}

If no reduction:

\begin{aligned} \mathrm{g}(x+2, y-0.5) &= (x+2)^2 + (y-0.5)^2 - r^2\\ &= (x+2)^2 + d_i - (x+1)^2\\ &= (x^2+4x+2^2) + d_i - (x^2+2x+1)\\ d_{i+1} &= d_i + 2x+ 3 \\ \end{aligned}

If reduction by 1:

\begin{aligned} \mathrm{g}(x+2, y-1.5) &= (x+2)^2 + (y-1.5)^2 - r^2 \\ &= (x+2)^2 + (y-1.5)^2 + d_i - (x+1)^2 - (y-0.5)^2\\ d_{i+1} &= d_i + 2x - 2y + 5\\ \end{aligned}

Midpoint Algorithm for Circles

In addition, the initial value $d_0$ of the decision variables is needed:

\begin{aligned} d_0 &= \mathrm{g}(x_0+1, y_0 + r-0.5)\\ &= \mathrm{g}(1, r-0.5)\\ &= (1)^2 + (r-0.5)^2 - r^2\\ &= 1 + r^2 -r + 0.25 - r^2\\ &= 1.25 - r \\ &= \frac{5}{4} - r\\ \end{aligned}

Midpoint Algorithm for Circles

function drawCircle(int x0, int y0, int radius) {

  int dHat = 5 - 4 * radius; // init decision variable 
  int x = 0;
  int y = radius;
  
  for(int x = 0; x <= y ; x++) {
    setSymmetricPixelCirle(x, y, x0, y0);
    if(dHat <= 0) { // no reduction of y
      dHat += 8*x + 12;
    }else {         // reduction of y by 1
      dHat += 8*x - 8*y + 20;
      y--;
    }
  }
}

Midpoint Algorithm for Circles

void setSymmetricPixelCirle(int x, int y, int x0, int y0) {
  setPixel( x+x0,  y+y0);
  setPixel(-x+x0,  y+y0);
  setPixel( x+x0, -y+y0);
  setPixel(-x+x0, -y+y0);
  setPixel( y+x0,  x+y0);
  setPixel(-y+x0,  x+y0);
  setPixel( y+x0, -x+y0);
  setPixel(-y+x0, -x+y0);
}
Raster Conversion of Polygons: Scanline Algorithm

scanline
$x$-coordinate
$y$-coordinate
scanline

Raster Conversion of Polygons: Scanline Algorithm

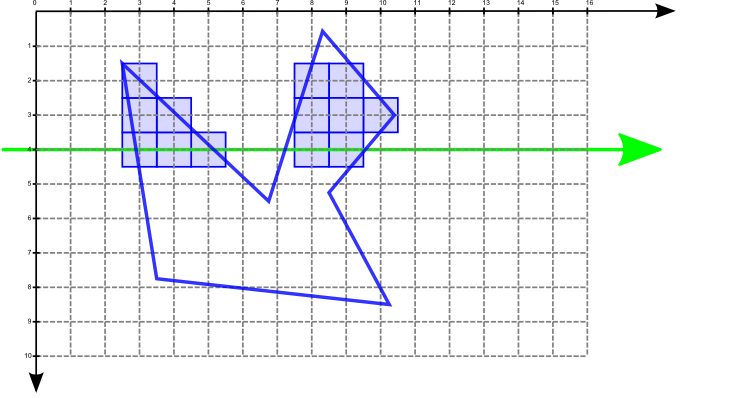
  • When using the scanline algorithm, the pixel grid is scanned line by line
  • Step 1: For each scanline the intersections with the edges of the polygon are computed
  • Step 2: These intersections are sorted in ascending order according to their $x$-coordinate
  • Step 3: Run through the pixels of the scanline starting at $x=0$. Draw pixels only if the parity of the previously traversed intersections is odd (rule of uneven parity)

Scanline Algorithm

The scanline algorithm can be implemented very efficiently by:

  • Incremental computation of the intersections
  • Reduction of the considered polygon edges per scanline

Scanline Algorithm

For this you will need:

  1. Edge data structure: $\mathbf{e} = (y_\mathrm{min}, y_\mathrm{max}, x_\mathrm{hit}, m^{-1})$
     class Edge {
       int yMin;     // smallest value of y (when edge enters)
       int yMax;     // largest value of y (when edge leaves)
       float xHit;   // intersection point (init with x value at yMin)
       float mInv;   // dx/dy (inverse line increment)
     }
  2. Edge table (ET): Contains all edges $(\mathbf{e}_1, ..., \mathbf{e}_k)$, sorted by $y_\mathrm{min}$. If $y_\mathrm{min}$ is the same, $x_\mathrm{hit}$ is used as secondary sort criterion
  3. Active edge table (AET): Contains all edges intersected by the current scanline, sorted by $x_\mathrm{hit}$

Scanline Algorithm

Initialize $y = y_\mathrm{min}$ using the first edge of the sorted ET
AET = $\emptyset$ (empty set)
REPEAT until AET = $\emptyset$ and ET = $\emptyset$
  Step 1:
Move those edges from the ET to the AET for which holds:
$y_\mathrm{min}$ = $y$ (incoming edges)

  Step 2:
Sort AET by $x_\mathrm{hit}$

  Step 3:
Draw pixel of the current scan line $y$ following the rule of uneven parity using the $x_\mathrm{hit}$-coordinates of the edges from the AET

  Step 4:
Remove from the AET those entries for which holds:
$y_\mathrm{max} = y $ (outgoing edges)

  Step 5:
Increase $y$ by 1 (next scanline)

  Step 6:
For each non-vertical edge in the AET, calculate a new $\hat{x}_\mathrm{hit}$ with $\hat{x}_\mathrm{hit} = x_\mathrm{hit} + m^{-1}$

END (Repeat)

Scanline Algorithm

An interactive demonstrator for the visualization of the scanline algorithm is available on the website of this lecture.
Pineda's Rasterization Algorithm

  • A simple, parallelizable algorithm for raster conversion of convex polygons was proposed by Pineda in 1988
pineda_inout
outside
outside
inside
outside
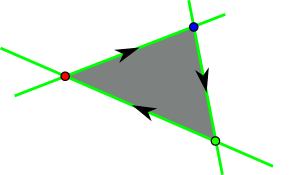
  • The basic idea: Use the Hessian normal form of the straight lines forming the edges of the polygon to determine whether a pixel is inside or outside of the polygon
  • To this end, it is assumed that the direction in which the edges circumvent the polygon is clockwise. If a pixel lies to the right of each line, it is inside
Source: Juan Pineda, A Parallel Algorithm for Polygon Rasterization, Computer Graphics, Volume 22, Number 4, 1988 (pdf)

Pineda's Rasterization Algorithm

  • Hessian normal form of a straight line:
hess_normal
$\mathbf{p}$
$\mathbf{p}_0$
$\mathbf{p}_1$
$\mathbf{n}$
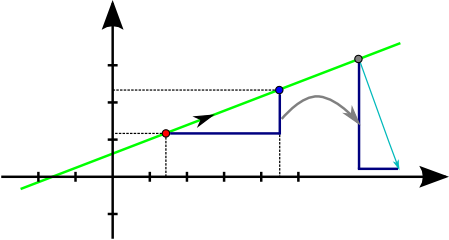
  • As can be seen from the figure, the direction of the normal $\mathbf{n}$ can be determined from the rotated gradient triangle
  • Thus, the normal is calculated by
    $\mathbf{n} = (n_x, n_y)^\top = (\Delta_y, -\Delta_x)^\top = (y_1-y_0, -(x_1-x_0))^\top$
  • The direction vector $\mathbf{p} - \mathbf{p}_0$ must be perpendicular to the normal, i.e. it holds
    $\mathbf{n}^\top (\mathbf{p} - \mathbf{p}_0) =0 \Leftrightarrow \mathbf{n}^\top \mathbf{p} - \mathbf{n}^\top \mathbf{p}_0$
  • This implicit equation for a line is called Hessian normal form

Pineda's Rasterization Algorithm

  • Hessian normal form: For each point $\mathbf{p}=(x,y)^\top$ on the straight line it holds:
    $\begin{align} \mathbf{n}^\top \mathbf{p} - \mathbf{n}^\top \mathbf{p}_0 &= 0 \\ \Leftrightarrow \frac{1}{|\mathbf{n}|}\left(\mathbf{n}^\top \mathbf{p} - \mathbf{n}^\top \mathbf{p}_0\right) &= 0\\ \Leftrightarrow a x + b y + c &= 0 \end{align}$
  • If the equation is not satisfied, then the point $\mathbf{p}=(x,y)^\top$ does not lie on the straight line and the distance is given directly by
    $\mathrm {d}(x,y) = \frac{1}{|\mathbf{n}|}\left(\mathbf{n}^\top \mathbf{p} - \mathbf{n}^\top \mathbf{p}_0\right)$
    pineda_inout
    outside
    outside
    inside
    outside
    • If $\mathrm {d}(x,y) > 0 \rightarrow$ point lies to the right
    • If $\mathrm {d}(x,y) = 0 \rightarrow$ point is on the line
    • If $\mathrm {d}(x,y) < 0 \rightarrow$ point lies to the left
  • If the pixel $\mathbf{p}=(x,y)^\top$ lies to the right of all edges, it is to be drawn, but not otherwise

Pineda's Rasterization Algorithm

  • Similar to the midpoint algorithm, the decision function can be computed incrementally for each line equation.
  • As before, only the sign is important. Since the non-normalized Hessian normal form can be calculated using integer arithmetic, it is used instead
  • For the first pixel: $\mathrm{d}'(x,y) = \mathbf{n}^\top \mathbf{p} - \mathbf{n}^\top \mathbf{p}_0$
  • For the subsequent pixels:
    $\begin{align}\mathrm{d}'(x+1,y) &= \mathrm{d}'(x,y) + \Delta_y & \mathrm{d}'(x-1,y) &= \mathrm{d}'(x,y) - \Delta_y\\ \mathrm{d}'(x,y+1) &= \mathrm{d}'(x,y) - \Delta_x & \mathrm{d}'(x,y-1) &= \mathrm{d}'(x,y) + \Delta_x \end{align}$
pineda_inout_raster

Pineda's Rasterization Algorithm

  • Optimizations
    • Only the pixels in a rectangular area around the polygon (the bounding box) must be considered
    • The rectangular area may be subdivided (e.g., in 4, 8, 16, etc. sub-areas) and the sub-areas can be processed in parallel
    • A new row can be started when after at least one drawn pixel the first pixel is outside (possibly it is necessary to search for the starting edge in the new line)
pineda_inout_raster2

Pineda's Rasterization Algorithm

An interactive demonstrator for the visualization of Pineda's algorithm is available on the website of this lecture.


Are there any questions?

questions

Please notify me by e-mail if you have questions, suggestions for improvement, or found typos: Contact

More lecture slides

Slides in German (Folien auf Deutsch)